E-commerce Conversion Rate Optimisation UK: 12 Fixes That Work (2026)
UK ecommerce conversion optimisation in 2026. Average UK CRO rate 1.6% — here are 12 fixes that push past 3%. Real data, checkout audit, sector benchmarks.
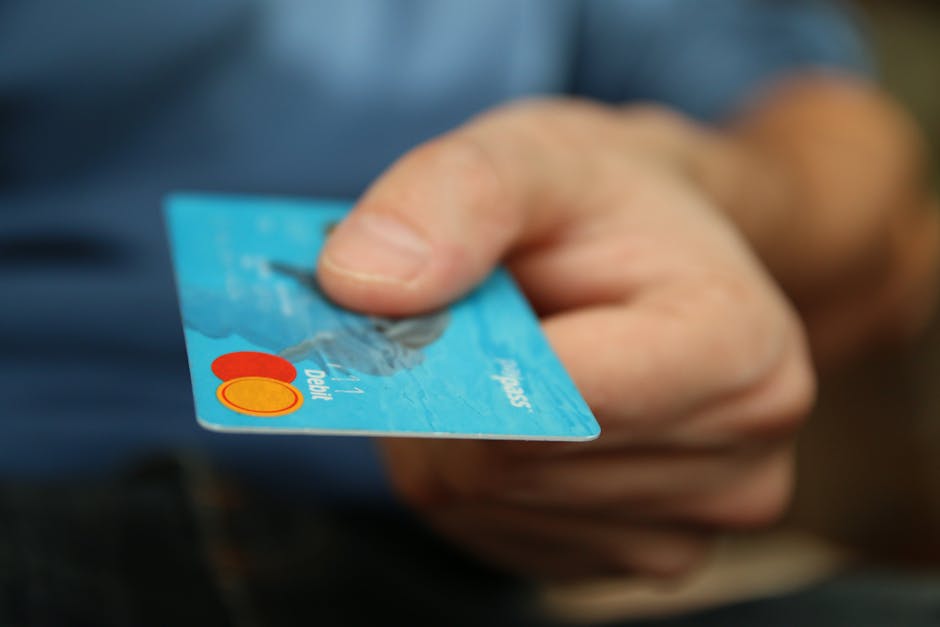
E-commerce conversion rates in the UK average 1.6% across all sectors. The businesses hitting 3–5% share three traits: fast load times (under 2 seconds on mobile), streamlined checkout (3 steps or fewer), and trust signals placed above the fold. Here is what to fix first.
UK E-commerce Conversion Rate Benchmarks by Sector
Most CRO guides quote a generic average. Here are the 2026 UK e-commerce conversion rates by sector — which changes what a "good" conversion rate means for your business: | Sector | Average Conversion Rate | Top-Quartile | |--------|------------------------|--------------| | Fashion/Apparel | 1.01% | 2.5% | | Electronics | 1.39% | 3.1% | | Health & Beauty | 3.08% | 5.5% | | Home & Garden | 1.88% | 3.8% | | Sports & Fitness | 1.63% | 3.5% | | B2B/Trade | 2.4% | 5.0% | *Sources: Statista UK E-Commerce Report 2024 / Monetate Ecommerce Quarterly.* Benchmark against your sector, not the overall mean. If you sell handmade furniture with a long consideration cycle, 0.8% may be strong performance relative to your category. If you sell health supplements, 1.5% is underperforming significantly.
The 3 Checkout Changes That Drive the Biggest Uplift
Baymard Institute 2024 research on UK cart abandonment reveals the precise levers that move checkout completion rates: **75% of UK carts are abandoned.** Of those: - **17%** abandon specifically at the point of mandatory account creation - **11%** abandon at unexpected shipping costs - **7%** abandon at payment security concerns **The three highest-ROI checkout changes, in order of uplift:** 1. **Remove mandatory account creation.** Removing forced account registration before purchase increases conversions **35% on average** (Baymard Institute). Make guest checkout the default. Account creation can be offered as an optional step after the order is confirmed — when the customer's mindset has shifted from buyer to recipient. 2. **Add a progress indicator.** Adding a step counter to checkout ("Step 2 of 3") increases checkout completion **20%** by reducing uncertainty about how much further the process extends. Users who cannot see an end point are more likely to abandon mid-flow. 3. **Enable one-click express checkout.** Apple Pay and Google Pay reduce checkout time by 60 seconds and increase mobile conversion **15–20%** by removing keyboard friction entirely on mobile (Sources: Baymard Institute; Shopify Plus conversion benchmarks 2024). UK mobile checkout completion rates increase by 28% when express checkout is available.
Mobile Conversion: The Gap UK E-commerce Businesses Are Missing
Ofcom 2025 data confirms UK mobile internet usage is the highest in Europe on a per-capita basis. Yet the mobile browse-to-buy gap persists: - **72%** of UK e-commerce browsing happens on mobile - **52%** of UK e-commerce purchases complete on mobile - **20-point gap** driven entirely by friction, not intent The five mobile friction points driving this gap: **Small touch targets.** WCAG 2.2 AA requires minimum 24×24px. Apple HIG recommends 44×44px. Most add-to-cart buttons meet this threshold. Filter toggles, wishlist icons, and quantity selectors frequently do not. **Filter and sort UX on mobile.** On desktop, sidebar filters work well. On mobile, the same filters collapse into an overlay modal. When the modal has no clear apply button, no results count, or no easy close path, shoppers abandon the category page entirely. **Form keyboard friction.** Mobile checkout forms that trigger the wrong keyboard type — alphabetic for a postcode field, standard keyboard for an email field — create visible friction. Implement `type='email'`, `type='tel'`, and `autocomplete='postal-code'` on all checkout form fields. **Page weight on slower connections.** Despite improving 5G coverage, 34% of UK mobile traffic travels over 4G or slower (Ofcom 2025). Product pages with uncompressed images and render-blocking scripts load in 8–12 seconds on 4G. Compress images to WebP, implement lazy loading, and defer non-critical JavaScript. **Cart continuity across devices.** Many UK shoppers browse on mobile and complete the purchase later on desktop. Persistent cart — saved across devices via account, or at minimum across sessions via localStorage — removes the re-discovery friction.
!Laptop showing data visualisation charts — tracking e-commerce conversion metrics and funnel performance *Photo by Lukas Blazek / Pexels*

Trust Signals That Convert UK Shoppers
UK consumers rank trustworthiness third in choosing an online store — after price and product range (Centre for Retail Research 2025). Trust signals must be authentic and specific. **Effective trust signals for UK e-commerce:** - **Third-party reviews** — Trustpilot, Google Reviews, or Feefo. Display aggregate rating on homepage and product pages. Reviews that include reviewer name, purchase date, and product name are trusted; anonymous reviews are not. - **Specific returns policy** — "Free 30-day returns" beats "We offer returns." Include the return window, whether collection or drop-off, and refund timeline. Ambiguity in returns is a primary purchase blocker for considered items. - **Real contact information** — Phone number, email address, physical address. Stores with visible contact details convert at measurably higher rates than those with only a contact form. - **Payment security indicators** — Display payment provider logos (Stripe, PayPal, Mastercard, Visa) at checkout. These function as trusted third-party endorsements. - **Plain-English data statement** — A short statement at checkout ("We use your data only to process this order") consistently outperforms references to a full privacy policy. UK consumers in 2026 are GDPR-aware and appreciate brevity over legalese.
12 CRO Fixes Ranked by Impact and Effort
These fixes are ordered by expected impact versus implementation effort, based on 2026 UK e-commerce audit data: **1. Switch to single-page or streamlined checkout.** 21.8% of UK cart abandonment cites checkout complexity as the primary reason. **2. Add guest checkout as the default.** Forcing account creation reduces conversions 24%. Make guest checkout primary. **3. Display trust signals at the point of decision.** Trust badges at cart and checkout (not just homepage) show 15–25% lift in checkout completions. **4. Reduce page load time to under 2 seconds.** Every 1-second delay reduces conversions by 7%. Test on mid-range Android on 4G, not desktop. **5. Optimise product images and descriptions.** 41% of UK shoppers leave product pages due to insufficient information (Yotpo 2025). **6. Implement abandoned cart recovery.** Only 8% of UK stores have an automated cart email sequence. A 3-email sequence recovers 5–15% of abandoned carts. **7. Add product reviews and social proof.** Products with 5+ verified reviews convert 270% better than products with no reviews. **8. Clarify delivery costs and timelines upfront.** Hidden delivery costs are cited by 56% of UK abandoners (IMRG 2025). Show estimated delivery cost on the product page. **9. Improve mobile navigation and product discovery.** Use the 5 friction points above as a mobile audit framework. **10. Use urgency and scarcity signals accurately.** Real urgency ("Only 3 left in stock" when genuinely true) lifts conversion. Fake countdown timers now backfire — UK consumers recognise manipulative patterns. **11. Make returns policy prominent.** Feature "Free 30-day returns" on product pages and in checkout, not buried in the footer. **12. Run structured A/B tests.** Each fix should be A/B tested rather than deployed as a global change. Split traffic 50/50, run for minimum 2 weeks, set a single primary metric.
How to Measure Your CRO Improvements
CRO measurement separates systematic improvement from guesswork. Establish your baseline before testing any change. **The four metrics that matter:** 1. **Overall e-commerce conversion rate** — total transactions ÷ total sessions × 100. Track weekly, smoothed with a 4-week rolling average for seasonality. 2. **Cart-to-checkout rate** — the percentage of sessions that reach checkout after adding to cart. Above 70% abandonment: checkout friction is your primary lever. 3. **Checkout-to-order rate** — the percentage of checkout sessions that complete. Below 60%: a checkout UX problem. Above 70%: strong. 4. **Revenue per visitor (RPV)** — average order value × conversion rate. This is the single number that captures CRO performance. A test that increases conversion but decreases average order value may not improve RPV. For the features that should be in place before CRO testing begins, see our ecommerce website features checklist.
!Customer unboxing a purchase while shopping online — optimising the e-commerce experience from browse to delivery *Photo by Antoni Shkraba Studio / Pexels*

Frequently Asked Questions
**What is a good e-commerce conversion rate in the UK?** A good e-commerce conversion rate for UK online stores is 2.5–3.5%. The UK average across all sectors is approximately 1.6% in 2026. Top-quartile UK stores convert at 3.5–5%. Fashion and accessories typically convert lower (0.5–1.5%) due to high browse-to-return rates, while health and beauty stores average 3.08% and can reach 5.5% at the top quartile. Benchmarking against your sector average is more useful than the overall mean. If you sell B2B trade products with high-intent, low-volume traffic, 2.4% may be strong performance. If you sell beauty products and are below 2%, that is a CRO problem worth addressing immediately.
**Why is my online store getting traffic but no sales?** Traffic without conversions typically points to one of four root causes: (1) traffic quality — if visitors are arriving via irrelevant keywords or social media with no purchase intent, no amount of CRO will fix the mismatch between audience and offer; (2) trust deficit — UK shoppers are experienced and sceptical; missing reviews, hidden contact details, unclear returns policy, and no visible payment logos all erode confidence at the point of decision; (3) product-page friction — insufficient images, missing size guides, no product-specific FAQs, and no social proof are the leading reasons UK shoppers leave without adding to cart (Yotpo 2025, 41% of respondents cite insufficient information); (4) checkout friction — if your cart-to-checkout rate is above 70% abandonment, or your checkout-to-order rate is below 60%, the problem is in the checkout flow itself, not earlier in the funnel.
**How do I reduce cart abandonment on my Shopify store?** To reduce cart abandonment on Shopify, prioritise these changes in order of impact: (1) Enable Shop Pay and one-click express checkout — this removes keyboard friction on mobile and reduces checkout time by 60 seconds, lifting mobile conversion 15–20%; (2) Remove mandatory account creation — make guest checkout the default path, offer account creation after order confirmation; (3) Show delivery cost on the product page, not just at checkout — hidden delivery costs cause 56% of UK cart abandonment; (4) Add a 3-email abandoned cart recovery sequence (1 hour, 24 hours, 72 hours) — this alone recovers 5–15% of abandoned carts with no traffic spend; (5) Display the Trustpilot rating and review count on product pages — social proof at the product level builds confidence before the customer reaches checkout.
**What are the most impactful checkout optimisation changes?** The six checkout changes that deliver the largest measured conversion uplift, in order of impact: (1) Removing mandatory account creation before checkout, which increases conversions 35% on average according to Baymard Institute 2024 data; (2) Enabling Apple Pay and Google Pay as express checkout options, which increases mobile checkout completion 15–20% by eliminating keyboard friction; (3) Adding inline address autocomplete via Google Places API, which reduces form-fill time 40% and eliminates delivery address errors; (4) Showing a progress indicator during checkout — which steps remain — which increases completion 20%; (5) Displaying trust badges (SSL, payment logos, Trustpilot) at the payment step, which drives 15–25% checkout completion uplift in A/B tests; (6) Showing the order summary throughout checkout (not just at the start), which reduces second-guessing and abandonment at the payment step.
**How much does conversion rate optimisation cost UK?** For UK e-commerce stores, DIY CRO using GA4, Microsoft Clarity (free heatmaps and session recordings), and systematic implementation of this guide's 12 fixes is a practical starting point for stores under £50,000 monthly revenue. For stores above £100,000 monthly revenue, a specialist CRO agency typically delivers 2–5× their fee in revenue uplift within the first 3 months, making engagement commercially justified. Agency CRO retainers in the UK typically run £1,500–£5,000/month for an active programme including A/B testing infrastructure, analytics setup, and monthly test cycles. The key constraint is traffic volume: CRO requires sufficient transaction data to produce statistically reliable A/B test results, and below certain thresholds, a disciplined in-house approach achieves as much as an agency engagement.
Ready to Improve Your Ecommerce Conversion Rate?
CRO is the most reliable lever for UK online stores looking to grow revenue without increasing advertising spend. The 12 fixes above are ordered by impact — implement systematically, measure each change, and iterate. At Launchwork Digital, our e-commerce website development UK includes CRO-optimised checkout flows, mobile-first product pages, and A/B testing infrastructure built into every project. If you are planning a new store or rebuilding an existing one, CRO principles embedded at the design stage deliver better results than retrofit. **Related reading:** - Ecommerce website features checklist — Core features before CRO testing begins - Ecommerce Website Development UK Guide — Full build guide - Web design that converts — Choosing the right partner